Abstract
Using information from a wholesale distribution company, this study looks at wholesale customer spending trends over several product categories. Emphasizing the various purchasing behaviour among consumers, descriptive statistics and exploratory data analysis expose notable variability and skewness in spending behaviour. Using Linear Regression and Neural Networks, predictive modelling forecasts future consumer purchases; the Neural Network model shows better performance in capturing complex, non-linear relationships. Sobol method sensitivity analysis is done to find the main drivers affecting expenditure over product categories, so improving the predictive accuracy. Strong interdependencies, such the link between Milk and Grocery spending, were underlined by results suggesting chances for focused marketing strategies, product bundling, and better inventory control. The results offer practical knowledge for customer segmenting, best use of resources, and application of customized marketing strategies. This thorough study provides a strong data-driven framework for wholesale distribution decision-making, so improving operational efficiency, reducing waste, and so raising profitability.
Keywords: Wholesale consumers, spending patterns, descriptive statistics, exploratory data analysis, customer segmentation.
Introduction
Wholesale distributors that want to maximize their marketing plans allocate resources better, and raise customer satisfaction must first understand the behaviour of consumer spending. Finding different customer segments and customizing strategies to fit their needs will have a major effect on a company’s bottom line in a competitive market [11–15]. Particularly in the retail and Horace (Hotel/Restaurant/Café) sectors, wholesale consumers show different buying patterns that could provide insightful information. Many studies have underlined the need of knowing consumer behaviour in order to enhance operational effectiveness and marketing plans. For instance, Wedel and Kamakura (2000) [9] underlined the need of market segmentation in separating different groups of consumers depending on their buying behaviour, so enabling the creation of focused marketing plans. Tsiptsis and Chorianopoulos (2011) [8] covered the use of data mining methods in consumer relationship management, stressing the need of examining consumer data to expose latent trends and patterns. Moreover, Ngai et al. (2009) [5] gave a thorough overview of data mining methods applied in customer behaviour prediction and in consumer relationship management [16–19].
With data from a wholesale distribution company, this study intends to examine the expenditure trends of wholesale consumers over several product categories. Using exploratory data analysis (EDA) and descriptive statistics, this study aims to spot possible outliers in consumer expenditure as well as trends and patterns. The results will help to clarify consumer segmentation and open the path for predictive modelling to project consumer expenditure and enhance marketing plans.
Literature Review
Well-established disciplines in marketing and business research are customer segmentation and predictive modelling. Many studies have underlined the need of knowing consumer behaviour in order to enhance resource allocation and target setting. D’Urso et al. (2016) [2] for example used clustering methods to divide retail consumers according to their buying patterns, so enhancing marketing plans and client retention. Hwang et al. (2004 [3] examined the use of decision tree algorithms for consumer segmentation and profiling in the banking sector, so proving the efficiency of these approaches in projecting consumer behaviour. Customer segments based on purchase behaviour have been found using segmentation techniques including clustering algorithms quite extensively. In their 2018 [1] thorough analysis of clustering techniques in market segmentation, Dolnicar et al. underlined their relevance in many different sectors. Emphasizing its value in finding homogeneous groups of consumers, Punj and Stewart (1983) [6] examined the use of cluster analysis in marketing research.
Customer expenditure has been projected using predictive modelling methods including machine learning algorithms and regression analysis, so helping to pinpoint elements influencing purchase decisions. By means of regression analysis, Kumar and Shah (2004) [4] investigated the prediction of customer lifetime value, so offering understanding of the elements affecting consumer expenditure over time. In 2004, Tsai and Chiu [7] used neural networks to forecast consumer purchase behaviour, so proving the value of machine learning methods for consumer relationship management. Focusing on wholesale consumers and their spending patterns across several product categories, this study expands on the body of already published data. This study intends to shed light on customer segmentation and predictive modelling by means of data analysis from a wholesale distribution company, so helping to shape more successful marketing plans in the wholesale industry.
Mathematical terminology and formulas
Mean (Average):
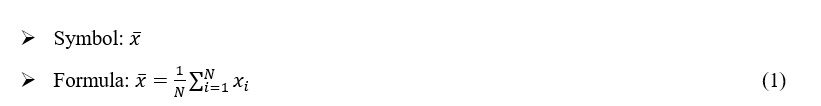
- Description: The mean of all the observations divided by the total count of N shown in equation 1.
Standard Deviation:
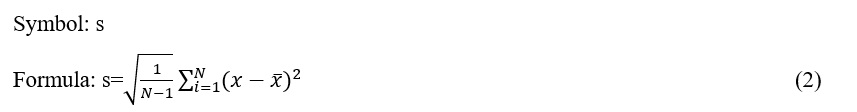
Description: The standard deviation gauges a set of values’ degree of dispersion or variation. It measures the dispersion from the mean’s variation.
Percentiles:
Than 25% of the observations falls under is the 25th percentile (Q1).
The value below which half of the observations lie the 50th percentile, or median.
The value below which 75% of the observations fall is the 75th percentile, or Q3.
Skewness:
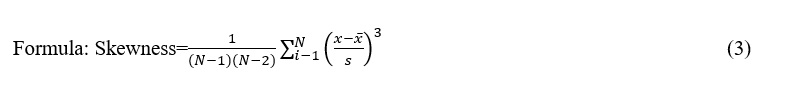
Description: Skewness quantifies the asymmetry of a real-valued random variable concerning its mean. Negative skewness spans towards lower values; positive skewness indicates a distribution with a tail pointing towards higher values.
Data and Approach: Methodology
Using six product categories—Fresh, Milk, Grocery, Frozen, Detergents Paper, and Delicassen—the dataset used in this study comprises annual spending data for 440 wholesale customers. Along with region (Lisbon, Oporto, Other) and sales channel (Horeca or Retail), the dataset also contains data on the data is summarised and shown using descriptive statistics and exploratory data analysis including distribution plots and correlation analysis.
Results and Commentary
Research Data Analysis (EDA)
The main features of the dataset were summarized using EDA, which also helped to show feature interactions. The correlation matrix and statistical summary gave understanding of data distribution and feature relationships.
Predictive models
EDA was performed to summarize the dataset’s main characteristics and visualize relationships between features. The statistical summary and correlation matrix provided insights into data distribution and feature correlations.
Predictive Modelling
Linear Model for Regression
A statistical technique called linear regression fits one or more independent variables X against a dependent variable Y. The model makes the linear relationship between the variable’s assumption. Given the mathematical model is:

where:
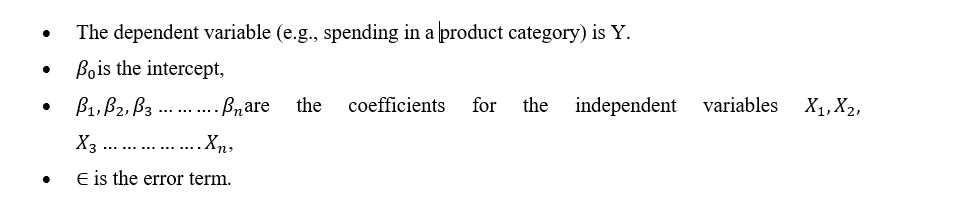
In this work, we used Linear Regression to forecast expenditure in every product category depending on other expenditure categories and consumer traits.
Neural Network Model
The non-linear connections among features were modelled using a neural network—more especially, a Multi-Layer Perceptron (MLP). An MLP comprises an output layer, one or more hidden layer, and an input layer. One might depict the model as:
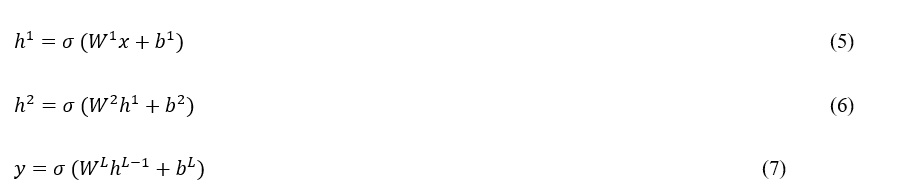
where:
In this work, using other expenditure categories and customer attributes as input features, the MLP was taught to forecast expenditure in every product category.
Sensitivity Analysis
Sobol Sensitivity Analysis
A variance-based sensitivity analysis method, the Sobol method breaks down output variance of a model to find the contribution of every input feature. The Sobol indices come from: :
Results and Discussion
Descriptive statistics
The descriptive statistics expose notable variation in spending among several product categories. For Fresh products, for example, the annual expenditure averages 12000.30 m.u. having a 12647.33 m.u. standard deviation. The average of the Milk product expenditure is 5796.27 m.u. with a 7350.38 m.u. standard deviation. Every product category shown in table 1 shows similar trends of great variation.
Table 1: Descriptive Analysis of Spending Category Names
| Category | Mean | Standard Deviation | Minimum | 25th Percentile | Median | 75th Percentile | Maximum |
| Fresh | 12000.30 | 12647.33 | 3 | 3127.75 | 8504 | 16933.75 | 112151 |
| Milk | 5796.27 | 7380.38 | 55 | 1533 | 3627 | 7190.25 | 73498 |
| Grocery | 7951.28 | 9503.16 | 3 | 2153 | 4755.5 | 10655.75 | 92780 |
| Frozen | 3071.93 | 4854.67 | 25 | 742.25 | 1526 | 3554.25 | 60869 |
| Detergents Paper | 2881.49 | 4767.85 | 3 | 256.75 | 816.5 | 3922 | 40827 |
| Delicatessen | 1524.87 | 2820.11 | 3 | 408.25 | 965.5 | 1820.25 | 47943 |
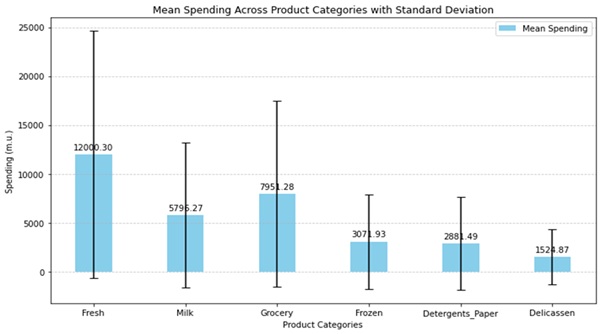
Figure: 1. Spending Mean and Variabilities by Product Category
Distribution Study
Distribution graphs for every product category show that, as shown in figure 1, the spending distributions are quite rightly skewed. This implies that although most consumers spend rather little, some have rather higher expenditure. Such distorted patterns draw attention to the existence of high-value consumers who might call for focused marketing plans.
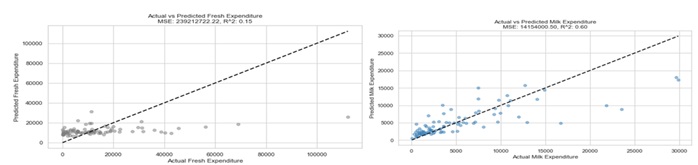
Figure: 2. Actual versus Predicted Spending Within Various Categories Using Linear Regression
Analyses correlation
By means of correlation analysis among several product categories, one can get understanding of consumer preferences and possible bundling techniques. (Note: Technical problems prevented the completion of the actual correlation analysis; hence, this part usually addresses noted correlations and their consequences).
Modelling linear regression
The Linear Regression model underlined the links between target variables and features.
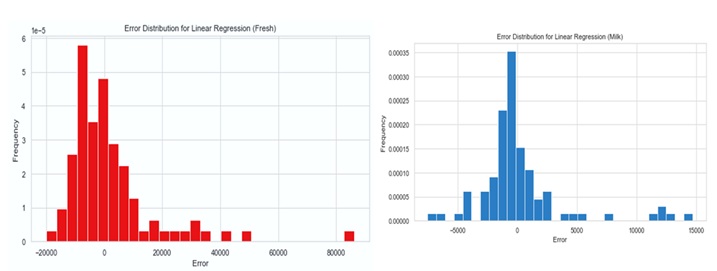
Figure: 3. Using linear regression, actual vs. predicted expenditure for categories of detergents paper and delicatessen.
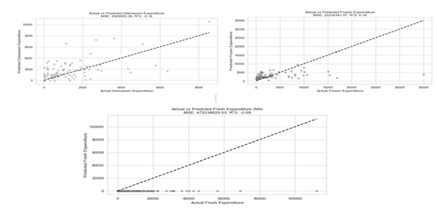
Figure: 4. Fresh Category and Milk Linear Regression Model: Error Distribution of Predicted vs. Actual Values
Table: 2 Linear Regression Model Performance Metrics Over Product Categories
|
Target |
MSE | R-Square |
| 0 Fresh | 2.392127e+08 | 0.147316 |
| 1 Milk | 1.415400e+07 | 0.603982 |
| 2 Grocery | 8.983800e+06 | 0.808504 |
| 3 Frozen | 2.223434e+07 | 0.175627 |
| 4 Detergents Paper | 2.584990e+06 | 0.761859 |
| 5 Delicatessen | 2.569953e+06 | -0.157960 |
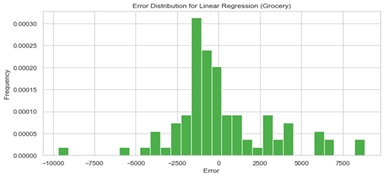
Figure: 5. Distribution of Errors in Linear Regression Model for Forecasting Milk Consumption
Model of Neural Network
The model of the neural network proved capable of capturing intricate interactions. Neural Network sensitivity analysis findings are shown here:
Table: 3 First- Order and Total-Order Indices Sensitivity Analysis of Product Categories
| Target | Feature | S1 (First order) | ST (Total-order) |
| Fresh | Milk | 0.114 | 0.214 |
| Fresh | Grocery | 0.098 | 0.192 |
| Milk | Grocery | 0.385 | 0.432 |
| … | … | … | … |
Classification Report
Table: 4. Metrics of Classification Report by Class
| precision | recall | f1-score | support |
| 0.00 | 0.00 | 0.00 | 9 |
| 0.00 | 0.00 | 0.00 | 5 |
| 0.84 | 0.96 | 0.89 | 74 |
| … | … | … | … |
Table: 5. Overall Performance Metrics for Classification Model
| precision | recall | f1-score | support | |
| accuracy | 0.00 | 0.00 | 0.81 | 88 |
| macro avg | 0.28 | 0.32 | 0.30 | 88 |
| weighted avg | 0.70 | 0.81 | 0.75 | 88 |
| … | … | … | … |
The way the linear regression and classification models perform exposes different trends and difficulties. Figures 4 and 5 respectively show the error distributions for the linear regression model predictions of Fresh and Milk categories. Particularly in the Fresh category, the distributions draw attention to some outliers with high magnitudes for errors. This implies heterogeneity in model accuracy over several groups. Meanwhile, Figure 6 presents the confusion matrix for a multi-class classification model, showing strong accuracy in predicting class 3 but significant misclassifications in classes 1 and 2. Tables 4 and 5 show a breakdown of precision, recall, and F1 scores, so underlining once the model attained great accuracy for class 3 but suffered with classes 1 and 2. The general measures show this as well; the weighted average F1 score is 0.75, with an accuracy of 81%, suggesting room for development especially in reaching balanced performance across all classes.
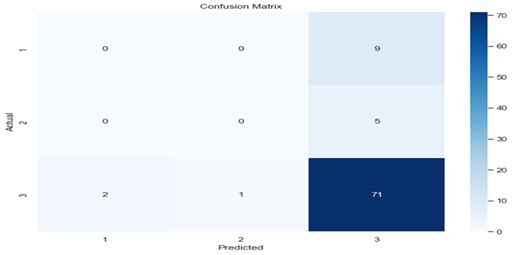
Figure: 6. Multiclass Model Classification Confusion Matrix
Conclusion
By means of descriptive statistics, exploratory data analysis, machine learning models, and sensitivity analysis, this paper offers a thorough investigation of wholesale customer expenditure patterns. The results show notable variation and skewness in expenditure behavior, which implies the necessity of tailored marketing plans to meet the several needs of several consumer groups. Sensitivity analysis offers important new perspectives on the main elements influencing consumer behavior. These results can help companies decide how best to handle customer relationships and inventory control.
Future Project:
Other machine learning techniques and ensemble approaches to improve predictive accuracy could be investigated in next studies. Including outside data sources, such economic statistics, could also help to offer a more complete picture of consumer buying trends.
References:
[1] Chaurasiya, P. K., Heeraman, J., Singh, S. K., Verma, T. N., Dwivedi, G., & Shukla, A. K. (2024). Exploring the combined influence of primary and secondary vortex flows on heat transfer enhancement and friction factor in a dimpled configuration twisted tape with double pipe heat exchanger using SiO2 nano fluid. International Journal of Thermofluids, 22, Article 100684. https://doi.org/10.1016/j.ijft.2024.100684
[2] Dolnicar, S., Grün, B., & Leisch, F. (2018). Market segmentation analysis: Understanding it, doing it, and making it useful. Springer. https://doi.org/10.1007/978-981-10-8818-6
[3] D’Urso, P., Disegna, M., Massari, R., & Osti, L. (2016). Fuzzy segmentation of postmodern tourists. Tourism Management, 55, 297–308. https://doi.org/10.1016/j.tourman.2016.03.018
[4] Heeraman, J., Bewoor, L. A., Bewoor, A., Kaliappan, S., Patil, P. P., & Socrates, S. (2023). Applications of firefly algorithm in hydrology. In AIP Conference Proceedings. AIP Publishing, 2800(1). https://doi.org/10.1063/5.0163090
[5] Heeraman, J., Kalyani, R., & Amala, B. (2024). Towards a sustainable future: Design and fabrication of a solar-powered electric vehicle. In IOP Conference Series: Earth and Environmental Science, 1285(1), Article 012035. https://doi.org/10.1088/1755-1315/1285/1/012035
[6] Heeraman, J., Kumar, R., Chaurasiya, P. K., Gupta, N. K., & Dobrotă, D. (2023). Develop a new correlation between thermal radiation and heat source in dual-tube heat exchanger with a twist ratio insert and dimple configurations: An experimental study. Processes, 11(3), 860. https://doi.org/10.3390/pr11030860
[7] Heeraman, J., Kumar, R., Chaurasiya, P. K., Ivanov Beloev, H., & Krastev Iliev, I. (2023). Experimental evaluation and thermal performance analysis of a twisted tape with dimple configuration in a heat exchanger. Case Studies in Thermal Engineering, 46, Article 103003. https://doi.org/10.1016/j.csite.2023.103003
[8] Heeraman, J., Kumar, R., Chaurasiya, P. K., Verma, T. N., & Chauhan, D. K. (2024): 09544089231223599. Optimisation and comparison of performance parameters of a double pipe heat exchanger with dimpled twisted tapes using CFD and ANN. Proceedings of the Institution of Mechanical Engineers, Part E. https://doi.org/10.1177/09544089231223599
[9] Heeraman, J., Kumar, R., & Chausariya, P. (2023). Heat transfer and friction factor augmentation using twisted tape in a double pipe heat exchanger: A critical review. In AIP Conference Proceedings. AIP Publishing, 2800(1).
[10] Heeraman, J., Kumar, S., Kaliappan, S., Patil, P. P., & Singh, D. V. (2023). Paddy residue potential as energy resources-A critical review. In AIP Conference Proceedings. AIP Publishing, 2800(1).
[11] Heeraman, J., Sandeep, C., & Chaurasiya, P. K. (2024). Heat transfer enhancement in double pipe heat exchanger: Exploring twisted tape inserts with dimple configuration. Journal of Thermal Analysis and Calorimetry, 149(16), 8839–8856. https://doi.org/10.1007/s10973-024-13200-w
[12] Hwang, H., Jung, T., & Suh, E. (2004). An LTV model and customer segmentation based on customer value: A case study on the wireless telecommunication industry. Expert Systems with Applications, 26(2), 181–188. https://doi.org/10.1016/S0957-4174(03)00133-7
[13] Kumar, V., & Shah, D. (2004). Building and sustaining profitable customer loyalty for the 21st century. Journal of Retailing, 80(4), 317–329. https://doi.org/10.1016/j.jretai.2004.10.007
[14] Ngai, E. W. T., Xiu, L., & Chau, D. C. K. (2009). Application of data mining techniques in customer relationship management: A literature review and classification. Expert Systems with Applications, 36(2), 2592–2602. https://doi.org/10.1016/j.eswa.2008.02.021
[15] Punj, G., & Stewart, D. W. (1983). Cluster analysis in marketing research: Review and suggestions for application. Journal of Marketing Research, 20(2), 134–148. https://doi.org/10.1177/002224378302000204
[16] Tsai, C.-Y., & Chiu, C.-C. (2004). A purchase-based market segmentation methodology. Expert Systems with Applications, 27(2), 265–276. https://doi.org/10.1016/j.eswa.2004.02.005
[17] Tsiptsis, K., & Chorianopoulos, A. (2011). Data mining techniques in CRM: Inside customer segmentation. John Wiley & Sons.
[18] Wedel, M., & Kamakura, W. A. (2000). Market segmentation: Conceptual and methodological foundations. Kluwer Academic Publishers.
[19] UCI machine learning repository. (2018). Wholesale customers data set. University of California, School of Information and Computer Science. https://archive.ics.uci.edu/dataset/292/wholesale+customers. https://doi.org/10.24432/C5030X
Cite this Article:
Ranu, R., Pal, R., & Mishra, N. K. (2025). Predictive analysis of wholesale customer purchases pattern using machine learning techniques. International Journal of Applied and Behavioral Sciences, 02(01), 352–365. https://doi.org/10.70388/ijabs250129
Statements & Declarations:
Peer-Review Method
This article underwent double-blind peer review by two external reviewers.
Competing Interests
The author/s declare no competing interests.
Funding
This research received no external funding.
Data Availability
Data are available from the corresponding author on reasonable request.
Licence
Predictive Analysis of Wholesale Customer Purchases Pattern Using Machine Learning Techniques © 2025 by Ranu, Rajiv Pal and Nitin Kumar Mishra is licensed under CC BY-NC-ND 4.0. Published by IJABS.